


- Abstract
- Video Abstract
- Keywords
- Introduction
- Methods
- Results
- Discussion
- Conclusions
- Implications
- Abbreviations
- Supplementary materials
- Author contributions
- Publication history
- AI disclosure
- Funding
- Trial registration
- Ethics statement
- Consent to publication
- Data availability
- Acknowledgements
- Conflicts of interest
- Copyright
- Publisher's note
- References
Family planning service use after the conversion of Basic Health Units into Maryam Nawaz Health Clinics in Punjab, Pakistan: an uncontrolled interrupted time series study
Published: 20 September 2026
Volume 2
Abstract
Modern contraceptive use in Pakistan remains low despite near-universal awareness, and the availability and organization of primary care services are recognized constraints. In 2025, selected 24/7 Basic Health Units (BHUs) in Punjab were converted into Maryam Nawaz Health Clinics (MNHCs), a contracted model of primary care. We examined whether family planning (FP) service use changed after conversion. We analyzed routinely collected monthly FP reports from the provincial district health information system for nine converted facilities in nine districts from June 2024 to May 2026. After the handover months (April–June 2025) were excluded, 199 facility-months remained (89 as BHUs, 110 as MNHCs). The prespecified primary outcome, total FP visits per facility-month, was analyzed by segmented (interrupted time series) mixed-effects regression with a facility random intercept, with a paired facility-level comparison (n = 9) as the fallback analysis; seven exploratory outcomes covering user categories and method mix were Holm-adjusted. FP visits were falling before conversion (−2.57 per month, 95% confidence interval [CI] −4.66 to −0.47). At conversion, visits rose by 58.85 (95% CI 39.62 to 78.09), and the trend changed by +4.80 visits per month, giving a postconversion slope of +2.24. Mean visits rose from 56.25 to 108.80 (adjusted difference 52.89, 95% CI 44.56 to 61.22; rate ratio 1.94), increasing for all nine facilities. The intrauterine contraceptive device (IUCD) share of FP visits rose by 14.7 percentage points (95% CI 11.84 to 17.51), increasing in all nine facilities and persisting when shares were recalculated among recorded methods only. Increases in the new-user, injectable and implant shares did not survive the paired analysis and are reported as suggestive. Visits not assigned to a method fell from 22.70% to 5.78%, so a concurrent change in reporting completeness cannot be ruled out. The design was uncontrolled, so these findings are associations rather than effects.
Video Abstract
Family planning service use after the conversion of Basic Health Units into Maryam Nawaz Health Clinics in Punjab, Pakistan: an uncontrolled interrupted time series study
by Usman Ali Khan et al.
Keywords
Contraception; Family planning; Interrupted time series; Long-acting reversible contraception; Pakistan; Primary health care
1. Introduction
The 2023 census recorded a population of 241.49 million in Pakistan, with an annual growth rate of 2.55%, one of the highest in the region [1]. Knowledge of contraception is not the main barrier. Almost all married women know of at least one modern method but only about a third use of any method [2], and among South Asian women who want no more children, Pakistan has the lowest prevalence of modern contraceptive use [3]. This persistent gap between knowledge and use points toward the health system as much as toward individual preference.
Recent evidence supports that view. A 2026 meta-analysis of 78 studies from South Asia revealed that women with access to a health facility offering family planning (FP) services were approximately twice as likely to use modern contraception (odds ratio [OR] 2.13, 95% confidence interval [CI] 1.12–4.05) and that counseling by health workers was also associated with greater use (OR 1.57, 95% CI 1.05–2.35) [4]. Individual and community characteristics still matter. Analyses of all four Pakistan Demographic and Health Surveys have shown that women’s education, employment, parity, household wealth, and community-level education shape contraceptive behavior [5], and knowledge of and access to contraceptives are independently linked to unmet needs [6]. Among adolescent and young married women, a lack of access to FP services was associated with more than three times the odds of unmet needs [7]. Supply-side conditions, in other words, are a modifiable part of the problem, and facility records are among the few places where changes in those conditions can be observed directly.
How services are delivered can change contraceptive use. A systematic review of 21 intervention studies from South Asia reported a pooled OR of 1.51 (95% CI 1.35–1.70) for modern contraceptive use, with health-system-integrated interventions performing comparably to demand-generation approaches [8]. In rural Sindh, a controlled before–after study that integrated FP with maternal and child health services, trained providers, and secured commodity supply reported an 11.7 percentage-point greater increase in modern method use in the intervention district, including more injectables and implants [9]. Two 2025 scoping reviews reached a consistent conclusion: integration works best when providers are trained, workloads are manageable, and supply chains are reliable [10,11].
Punjab has a long record of reorganizing its first-level facilities. The 24/7 Basic Health Unit (BHU) initiative extended selected BHUs to round-the-clock maternity care, and implementation research designed to support its scale-up was established to compare government-collected facility data with survey data and to examine performance at the directorate, district, and facility levels rather than relying on provincial averages [12]. In January 2025, the provincial government launched the Maryam Nawaz Health Clinic (MNHC) program, under which 150 health centers were to be converted into MNHCs managed by contracted doctors, with a fully digital patient pathway from registration to treatment [13]. Conversions took place in phases during 2025. Contracting the management of primary care is not new to the region. A 2026 meta-analysis of studies from low- and lower-middle-income countries revealed that contracting was associated with a 12% increase in the utilization of FP services [14], and government purchases of services from private providers have also been reviewed across the Eastern Mediterranean region, which includes Pakistan [15].
What is missing is facility-level evidence on how FP services change when a public primary-care facility is reorganized. National surveys cannot show variation between service-delivery points. A 2026 mapping study of public-sector FP centers in Rawalpindi revealed that condoms accounted for approximately 84–87% of recorded method use, followed by oral pills (6–8%), injectables (3–4%), and intrauterine contraceptive devices (IUCDs; approximately 1.5–2%), and it identified the lack of detailed facility-level uptake data as an important gap [16]. Evaluations that use routine data have reported encouraging results. A difference-in-differences analysis of logistics data revealed that the Challenge Initiative, which works through government facilities in urban Punjab and Sindh, was associated with a significant net increase in monthly FP clients [17], and its community health volunteers were associated with greater provision of short- and long-acting methods at the facility level [18]. In the private sector, social-franchise clinics served relatively few clients, and client privacy strongly influenced visit volume [19]. Gains can also fade: after two voucher programs in Punjab closed, IUCD use among former clients fell from 54% to 13% [20]. Uptake and continuation are also different outcomes. In a Lahore cohort, 75% of women who received a postpartum implant were still using it after three years, and side effects and family pressure were the main reasons for removal [21].
Routine data carry their own limits. A review of FP registers and reporting tools in 18 low- and middle-income countries revealed wide variation in method detail, disaggregation, and indicator definitions, which affects comparability [22]. The main strength of routine data is repetition: monthly observations allow changes to be tracked over time rather than inferred from two cross-sectional snapshots, as interrupted time series analyses of primary care visit data have shown [23]. Given this background, the present study examined whether FP service use changed when 24/7 BHUs in nine districts of Punjab were converted into MNHCs. Our prespecified primary objective was to estimate the change in total FP visits per facility-month associated with conversion, using a segmented (interrupted time series) analysis of monthly facility reports that distinguishes a change in level at conversion from the trend that preceded it. Second, exploratory objectives were to describe changes in the share of visits made by new and by repeat users and in the contraceptive method mix and to quantify how much reporting completeness changed at the same time as the model of care.
2. Methods
2.1. Study design and reporting
We conducted a retrospective analysis of routinely reported monthly FP data from nine public primary care facilities before and after each was converted from a 24/7 BHU into a MNHC. The facility-month was the unit of analysis. The primary analysis was a segmented (interrupted time series) mixed-effects regression; the design remains uncontrolled because no facilities that retained the BHU model were observed over the same period. Reporting follows the RECORD statement for studies using routinely collected health data [24], and the completed checklist is provided in Supplementary File S1.
2.2. Setting and intervention
The study included nine public primary care facilities, one in each of the districts of Attock, Bahawalpur, Chakwal, Dera Ghazi Khan, Faisalabad, Lahore, Multan, Rawalpindi, and Sahiwal. Before the transition, each facility functioned as a 24/7 BHU providing round-the-clock maternity care alongside routine primary care services, including FP. Each facility was then converted into an MNHC under the provincial program described above. Under this model, the management of the facility is contracted to a qualified doctor through the District Health Authority, the facility remains publicly owned, services are recorded through an electronic medical record, and FP counseling and contraceptive provision continue as part of the routine service package. The handover of all nine facilities occurred between April and June 2025, and MNHC reporting began in May or June 2025, depending on the facility.
2.3. Facility selection
The same nine facilities were observed in both periods; thus, each facility served as its own comparison. One facility was included from each of the nine districts; facilities were eligible if they had operated as a 24/7 BHU before conversion to an MNHC and had monthly FP reports available for both the pre- and posttransition periods. How the single facility was chosen from among the eligible converted facilities in each district was not recorded at the time of extraction and could not be reconstructed; this is acknowledged as a limitation. No facility that met the eligibility criteria was excluded for reasons of data quality or availability, and no facility-month was excluded other than the handover months described below (RECORD 13.1).
2.4. Data source and extraction
Monthly FP data were extracted from routine facility reports submitted to the provincial district health information system. Only aggregated facility-level figures were obtained; no individual client records were accessed.
2.5. Study periods
The pretransition period ran from June 2024 to March 2025 (10 months), when the facilities operated as 24/7 BHUs. April to June 2025 was treated as a handover period, and BHU reports from these months were excluded because they no longer reflected the pretransition model of care. MNHC reporting began when each facility was converted, in May or June 2025, and all available MNHC monthly reports from then until May 2026 were retained as posttransition observations. Facilities converted in May 2025 therefore contributed 13 posttransition months, and those converted in June 2025 contributed 12, resulting in 110 posttransition observations.
2.6. Variables and definitions
Outcomes were taken from the monthly FP report as submitted. The prespecified primary outcome was the total number of FP visits per facility-month. Seven outcomes were treated as exploratory: the share of visits made by new users (clients accepting a contraceptive method at the facility for the first time) and by repeat users (clients returning for follow-up or resupply) and the share of visits at which condoms, oral contraceptive pills, implants, IUCDs or injectables were provided. For each facility-month, each share was calculated as the number of users divided by total FP visits, multiplied by 100. Because neither the new and repeat categories nor the five method categories sum to total visits, visits recorded under other categories (for example, counseling-only visits or methods not reported separately) remain in the denominator; the size of this residual category is reported as an outcome in its own right because it serves as an indicator of reporting completeness. Absolute counts per facility-month are reported alongside every share because a share can decrease while volume increases. Repeat-user figures describe returning clients in aggregate and were not interpreted as method continuation, which would require linking individual clients over time. No codes or algorithms were used to select or classify records beyond the indicator definitions printed on the monthly FP report form; the categories on the form were used as received and were not redefined (RECORD 6.1, 7.1).
2.7. Data quality and access
The investigators received the full set of monthly FP reports submitted by the nine study facilities for the study window and had no access to the wider district health information system population from which those facilities were drawn (RECORD 12.1). Records were checked for duplicate entries, consistency of facility identifiers, and agreement between reported indicators. Facility-months without a report were treated as missing rather than as zero utilization; one pretransition month (Bahawalpur, June 2024) was unavailable, yielding 89 rather than 90 pretransition observations. Each facility-month was screened for implausible entries, such as negative values or method-specific counts exceeding total FP visits. No facility-month met these criteria, and no values were corrected, removed, or imputed; all 199 available facility-months were retained (RECORD 12.2). No linkage across databases was performed (RECORD 12.3).
2.8. Statistical analysis
The analysis unit was the facility-month, and repeated observations from the same facility were not independent: the intraclass correlation for total FP visits was 0.177. All the models therefore included a random intercept for the facility. For the primary outcome, we fitted a segmented (interrupted time series) linear mixed model of the form visits ~ time + period + time since conversion, with time centered on each facility's own conversion month, estimating the pretransition monthly trend, the level change at conversion, and the change in monthly trend afterwards. A period-only mixed model gave the adjusted mean difference between periods, and a Poisson generalized estimating equation with an exchangeable working correlation and a log link gave the corresponding rate ratio. Exploratory outcomes were analyzed with the same period-only mixed model on the facility-month share and with Poisson generalized estimating equations offset by total visits to obtain rate ratios. Because only nine clusters were available, Wald CIs were reported, and p values were also referred to a t distribution with 8 degrees of freedom as a conservative small-cluster check. The fallback analysis, which makes no distributional assumption about the within-facility structure, collapsed each facility to its period mean and compared the nine pairs with a paired t test and a Wilcoxon signed-rank test; an outcome was treated as robust only when it reached significance in both the mixed model and the paired analysis. Familywise error across the seven exploratory outcomes was controlled with the Holm procedure; the primary outcome was not adjusted. Two prespecified sensitivity analyses were performed. First, method shares were recalculated with the sum of the five recorded methods as the denominator to test whether the method-mix findings depended on the shrinking residual category. In the second, the first three MNHC months per facility were excluded to test whether the findings depended on the period when MNHC reporting was still being established. All tests were two-sided, with significance at p < 0.05. Analyses were performed in Python 3.11 with statsmodels 0.15.
2.9. Ethical considerations
Ethical approval was granted by the DSI Research Ethics Committee (reference no. DSI-REC/26/00001), and permission to use the data were obtained from the Project Management Unit of the Punjab Family Planning Program, Health and Population Department, Government of Punjab. The study analyzed aggregated facility-level reports that contained no individual client identifiers, and no individual client records were accessed; therefore, the ethics committee waived the requirement for individual informed consent. The study was conducted in accordance with the principles of the Declaration of Helsinki.
3. Results
The analysis included 199 facility-months from nine facilities: 89 while they operated as 24/7 BHUs and 110 after conversion to MNHCs. Each facility contributed 9 or 10 pretransition months; seven facilities converted in June 2025 and contributed 12 posttransition months, and two (Attock and Faisalabad) converted in May 2025 and contributed 13. The nine facilities recorded 5,006 FP visits in total during the pretransition period and 11,968 during the posttransition period.
Primary outcome: FP visits per facility-month decreased before conversion (−2.57 visits per month; 95% CI −4.66 to −0.47; p = 0.017). At conversion, the number of visits increased by 58.85 (95% CI 39.62 to 78.09; p < 0.001), and the monthly trend increased by 4.80 (95% CI 2.21 to 7.40; p < 0.001), indicating a posttransition trend of +2.24 visits per month under the MNHC model (Figure 1; Table 1). In the period-only mixed model, the adjusted difference in mean monthly visits was 52.89 (95% CI 44.56 to 61.22; p < 0.001) compared with the unadjusted means of 56.25 and 108.80, and the rate ratio was 1.94 (95% CI 1.46 to 2.60). The findings held in the fallback analysis: the paired facility-level difference was 52.94 visits (95% CI 33.28 to 72.61; p < 0.001; Wilcoxon p = 0.0039), and the number of monthly visits increased for all nine facilities.
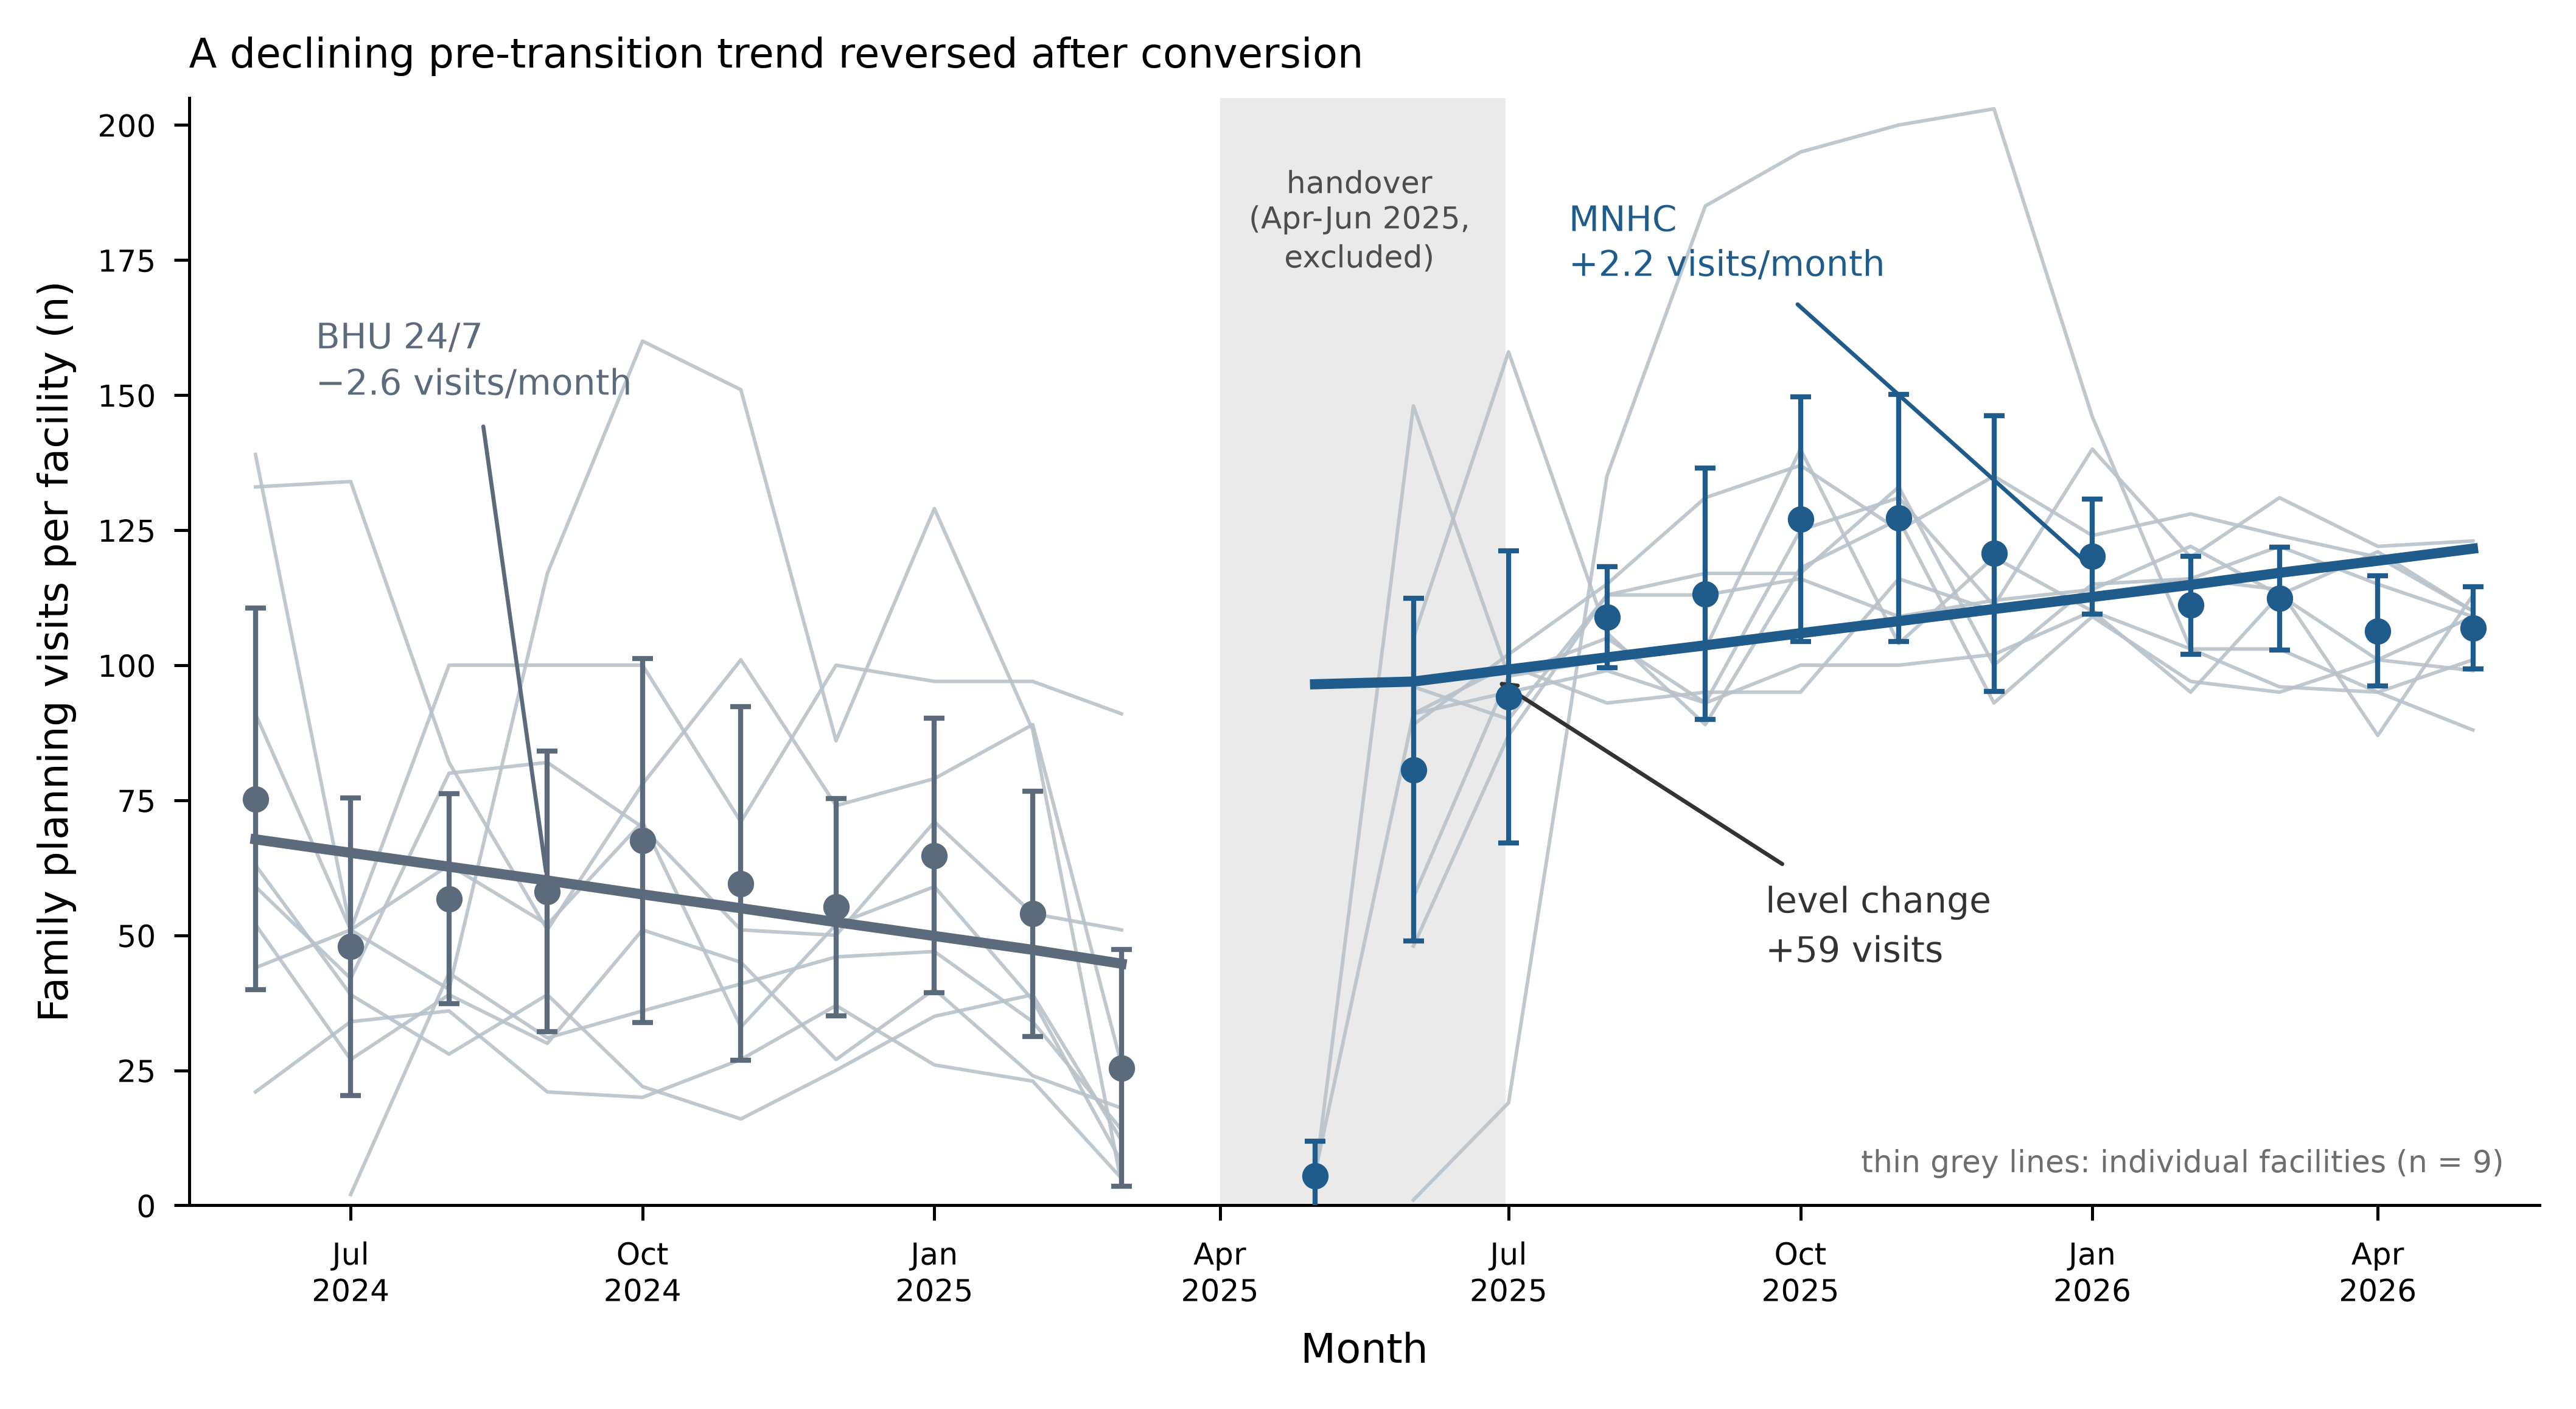
Figure 1. Monthly family planning visits per facility before and after the conversion of 24/7 Basic Health Units into Maryam Nawaz Health Clinics, nine districts of Punjab, June 2024 to May 2026. The colored markers are the means across facilities reported in that month with 95% confidence intervals; the thin gray lines are individual facilities (n = 9); and the heavy lines are the fitted segmented mixed-effects model. The shaded band is the April–June 2025 handover window, whose BHU reports were excluded. The first month, the Maryam Nawaz Health Clinic (May 2025), includes only the two facilities converted during that month. BHU = Basic Health Unit; MNHC = Maryam Nawaz Health Clinic.
| Analysis | Estimate | 95% CI | p Value |
| Pretransition trend (per month) | -2.57 | -4.66 to -0.47 | 0.017 |
| Level change at conversion | 58.85 | 39.62 to 78.09 | < 0.001 |
| Trend change after conversion (per month) | 4.80 | 2.21 to 7.40 | < 0.001 |
| Posttransition monthly trend (visits/month, derived) | 2.24 | - | - |
| Adjusted mean difference between periods (visits) | 52.89 | 44.56 to 61.22 | < 0.001 |
| Rate ratio between periods (Poisson GEE) | 1.94 | 1.46 to 2.60 | < 0.001 |
| Paired facility-level mean difference (n = 9 facilities) | 52.94 | 33.28 to 72.61 | < 0.001 |
| Note: 199 facility-months from nine facilities (89 Basic Health Unit, 110 Maryam Nawaz Health Clinic). The first three rows are from a segmented (interrupted time series) linear mixed model with a random intercept and time centered on each facility's conversion month. Referring to the same test statistics to a t distribution with 8 degrees of freedom, as a conservative small-cluster check, yields p = 0.044, < 0.001 and 0.007 for the pretransition trend, level change and trend change, respectively. Wilcoxon signed-rank p = 0.0039 for the paired comparison. The intraclass correlation for total visits was 0.177. CI = confidence interval; GEE = generalized estimating equation. | |||
Exploratory outcomes: service volume by user category. The absolute numbers increased in both user categories, from 33.72 to 76.79 new users and from 15.84 to 31.76 repeat users per facility-month. As a share of visits, new users rose 9.56 percentage points (95% CI 2.90 to 16.21; Holm-adjusted p = 0.020) in the mixed model, but the paired facility-level difference was 9.48 points, with a CI spanning zero (−15.53 to 34.50; p = 0.408), and the share rose in only 5 of 9 facilities; the rate ratio was 1.17 (95% CI 0.90 to 1.51). The repeat-user share rose 5.16 points (Holm-adjusted p = 0.092) and likewise did not survive the paired analysis (p = 0.442). Neither user-category finding is treated as robust (Table 2).
| Outcome | Mean per Facility- Month, BHU/MNHC (n) |
Ratio | Share of Visits, BHU/MNHC (%) |
Adjusted Difference (95% CI) |
Holm p | Paired Difference, n = 9 (95% CI) |
Holm p | Rate Ratio (95% CI) |
Facilities Increasing |
| Total FP visits (primary) | 56.25/108.80 | 1.93 | - | 52.89 (44.56 to 61.22) | - | 52.94 (33.28 to 72.61) | - | 1.94 (1.46 to 2.60) | 9/9 |
| New FP users | 33.72/76.79 | 2.28 | 59.45/69.00 | 9.56 (2.90 to 16.21) | 0.020 | 9.48 (-15.53 to 34.50) | 1.000 | 1.17 (0.90 to 1.51) | 5/9 |
| Repeat FP users | 15.84/31.76 | 2.00 | 24.45/29.82 | 5.16 (0.48 to 9.85) | 0.092 | 5.25 (-9.71 to 20.20) | 1.000 | 1.05 (0.68 to 1.61) | 6/9 |
| Condoms | 22.11/37.10 | 1.68 | 37.83/33.98 | -4.11 (-10.27 to 2.04) | 0.380 | -4.30 (-24.38 to 15.78) | 1.000 | 0.86 (0.57 to 1.30) | 5/9 |
| Oral contraceptive pills | 9.46/17.29 | 1.83 | 15.82/15.65 | -0.08 (-3.02 to 2.86) | 0.957 | -0.01 (-6.43 to 6.42) | 1.000 | 0.98 (0.70 to 1.38) | 4/9 |
| Implants | 0.07/1.47 | 21.85 | 0.10/1.36 | 1.26 (0.56 to 1.96) | 0.003 | 1.25 (-0.66 to 3.16) | 1.000 | 4.16 (1.95 to 8.87) | 3/9 |
| IUCDs | 4.46/23.71 | 5.32 | 7.01/21.66 | 14.68 (11.84 to 17.51) | < 0.001 | 14.75 (8.45 to 21.06) | 0.005 | 2.66 (1.83 to 3.88) | 9/9 |
| Injectables | 10.61/24.29 | 2.29 | 16.54/21.57 | 5.01 (2.05 to 7.97) | 0.005 | 5.11 (-4.54 to 14.76) | 1.000 | 1.19 (0.75 to 1.90) | 6/9 |
| Note: 89 facility-months before and 110 after conversion; each facility contributed 9 or 10 pretransition months and 12 or 13 posttransition months. Adjusted differences are from a period-only linear mixed model with a random intercept and are in visits for the primary outcome and in percentage points for all others. Paired differences compare facility period means across the nine facilities. Holm adjustment was performed across the seven exploratory outcomes; the primary outcome was not adjusted. Rate ratios are from Poisson generalized estimating equations, offset by total visits for all outcomes except total visits itself. BHU = Basic Health Unit; CI = confidence interval; IUCD = intrauterine contraceptive device; MNHC = Maryam Nawaz Health Clinic. | |||||||||
Exploratory outcomes: method volume and method mix. Every method increased in absolute volume (Figure 2). Mean monthly clients per facility rose from 4.46 to 23.71 for IUCDs (5.32-fold), from 10.61 to 24.29 for injectables, from 22.11 to 37.10 for condoms, from 9.46 to 17.29 for pills, and from 0.07 to 1.47 for implants. Only the IUCD share of visits rose substantially, by 14.68 percentage points (95% CI 11.84 to 17.51; Holm-adjusted p < 0.001), a change that also held in the fallback analysis (14.75 points, 95% CI 8.45 to 21.06; Holm-adjusted paired p = 0.005) and occurred in 9 of 9 facilities; the rate ratio was 2.66 (95% CI 1.83 to 3.88). The segmented model revealed no pretransition trend in the IUCD share (-0.44 points per month; p = 0.181), a rise of 7.29 points at conversion (95% CI 1.43 to 13.14; p = 0.015) and a continuing increase of 2.31 points per month thereafter (95% CI 1.52 to 3.10; p < 0.001); thus, the shift accumulated over the year rather than appearing as a single step.
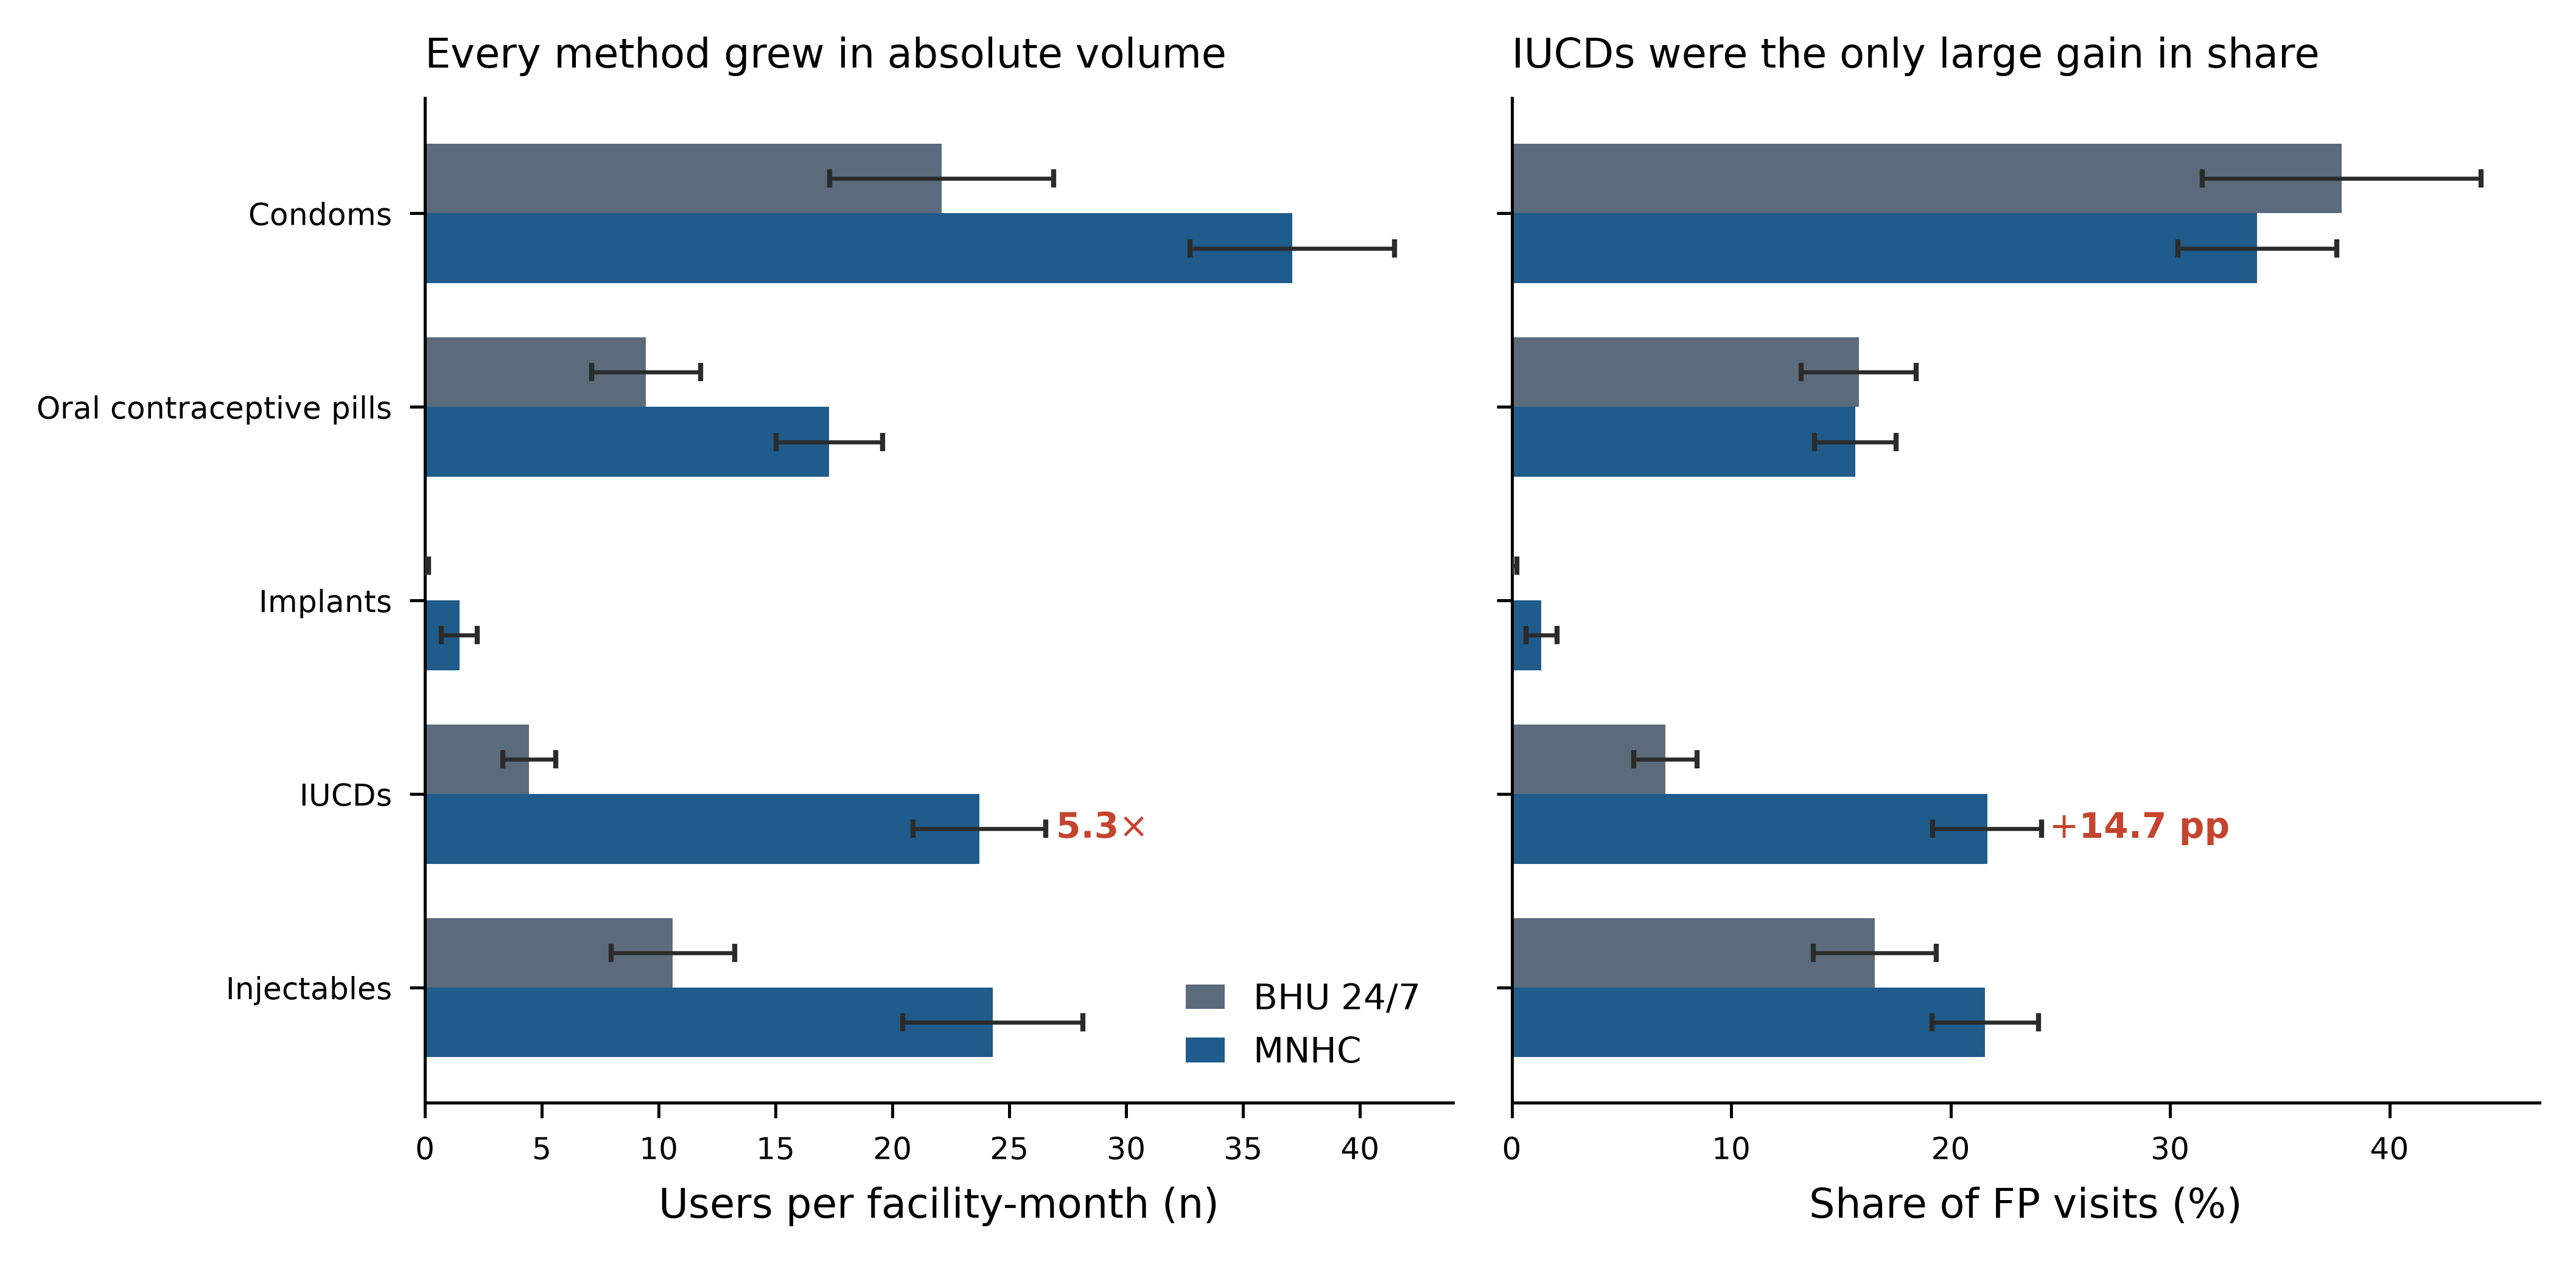
Figure 2. Contraceptive method provisions before and after conversion, as absolute clients per facility month (left) and as a share of family planning visits (right). The bars are unadjusted means with 95% confidence intervals; 89 facility-months before and 110 months after conversion. Dots indicate values that are too small to render as a bar. The absolute volume increased for all five methods; only the intrauterine contraceptive device share increased substantially.
The injectable share rose 5.01 points (95% CI 2.05 to 7.97; Holm-adjusted p = 0.005), and the implant share rose 1.26 points (95% CI 0.56 to 1.96; Holm-adjusted p = 0.003) in the mixed model, but neither survived the paired analysis (p = 0.257 and 0.169), the injectable rate ratio spanned unity (1.19, 95% CI 0.75 to 1.90), and the shares rose in only 6 and 3 of 9 facilities, respectively. Condom and pill shares did not change significantly (−4.11 and −0.08 points, respectively). The injectable and implant findings are therefore reported as suggestive.
Reporting completeness and sensitivity analyses. The share of visits not assigned to any of the five methods fell from 22.70% before conversion to 5.78% after conversion, and the share not assigned to either the new or the repeat category fell from 16.10% to 1.18% (Table 3; Figure 3). Because a previously unassigned block of visits was assigned, part of the method-mix change could reflect reclassification. When method shares were recalculated with the five recorded methods as the denominator, the IUCD gain persisted (13.47 points, 95% CI 10.25 to 16.69; Holm-adjusted p < 0.001), and the implant gain persisted (1.14 points, 95% CI 0.34 to 1.94), but the injectable gain did not (3.18 points, 95% CI −1.59 to 7.95; Holm-adjusted p = 0.191), and the pill share fell (−11.93 points, 95% CI −16.77 to −7.10; Holm-adjusted p < 0.001) because pill volume increased more slowly than total method volume did. Excluding the first three MNHC months per facility (172 facility-months) did not weaken the robust findings; it strengthened them. The adjusted difference in visits was 60.06 (95% CI 52.66 to 67.47), and the difference in the IUCD share was 17.06 points (95% CI 14.39 to 19.73), whereas the paired analysis failed for the new-user, injectable and implant shares (p = 0.383, 0.315 and 0.166, respectively).
| Indicator/Analysis | BHU/MNHC Mean | Adjusted Difference (95% CI) |
p Value |
| Visits not assigned to any of the five methods (%) | 22.70/5.78 | -16.77 (-23.80 to -9.74) | < 0.001 |
| Visits not assigned to new or repeat user (%) | 16.10/1.18 | -14.73 (-20.26 to -9.19) | < 0.001 |
| Sensitivity 1: method share renormalized to the five recorded methods | |||
| Condoms | 41.06/34.30 | -6.06 (-12.40 to 0.27) | 0.122 |
| Oral contraceptive pills | 27.49/16.85 | -11.93 (-16.77 to -7.10) | < 0.001 |
| Implants | 0.10/1.47 | 1.14 (0.34 to 1.94) | 0.016 |
| IUCDs | 9.27/23.15 | 13.47 (10.25 to 16.69) | < 0.001 |
| Injectables | 22.07/24.24 | 3.18 (-1.59 to 7.95) | 0.191 |
| Sensitivity 2: first three MNHC months per facility excluded (n = 172) | |||
| Total FP visits (n) | - | 60.06 (52.66 to 67.47) | < 0.001; paired p = < 0.001 |
| IUCD share (%) | - | 17.06 (14.39 to 19.73) | < 0.001; paired p = < 0.001 |
| New-user share (%) | - | 9.90 (2.97 to 16.84) | 0.005; paired p = 0.383 |
| Injectable share (%) | - | 5.18 (2.07 to 8.29) | 0.001; paired p = 0.315 |
| Implant share (%) | - | 1.69 (0.91 to 2.46) | < 0.001; paired p = 0.166 |
| Note: Adjusted differences are from period-only linear mixed models with a random intercept, in percentage points, unless stated otherwise. The Holm adjustment for the renormalized method analysis is across the five methods. Eight facility-months recorded no method-specific users and were excluded from the renormalized analysis. BHU = Basic Health Unit; CI = confidence interval; MNHC = Maryam Nawaz Health Clinic. | |||
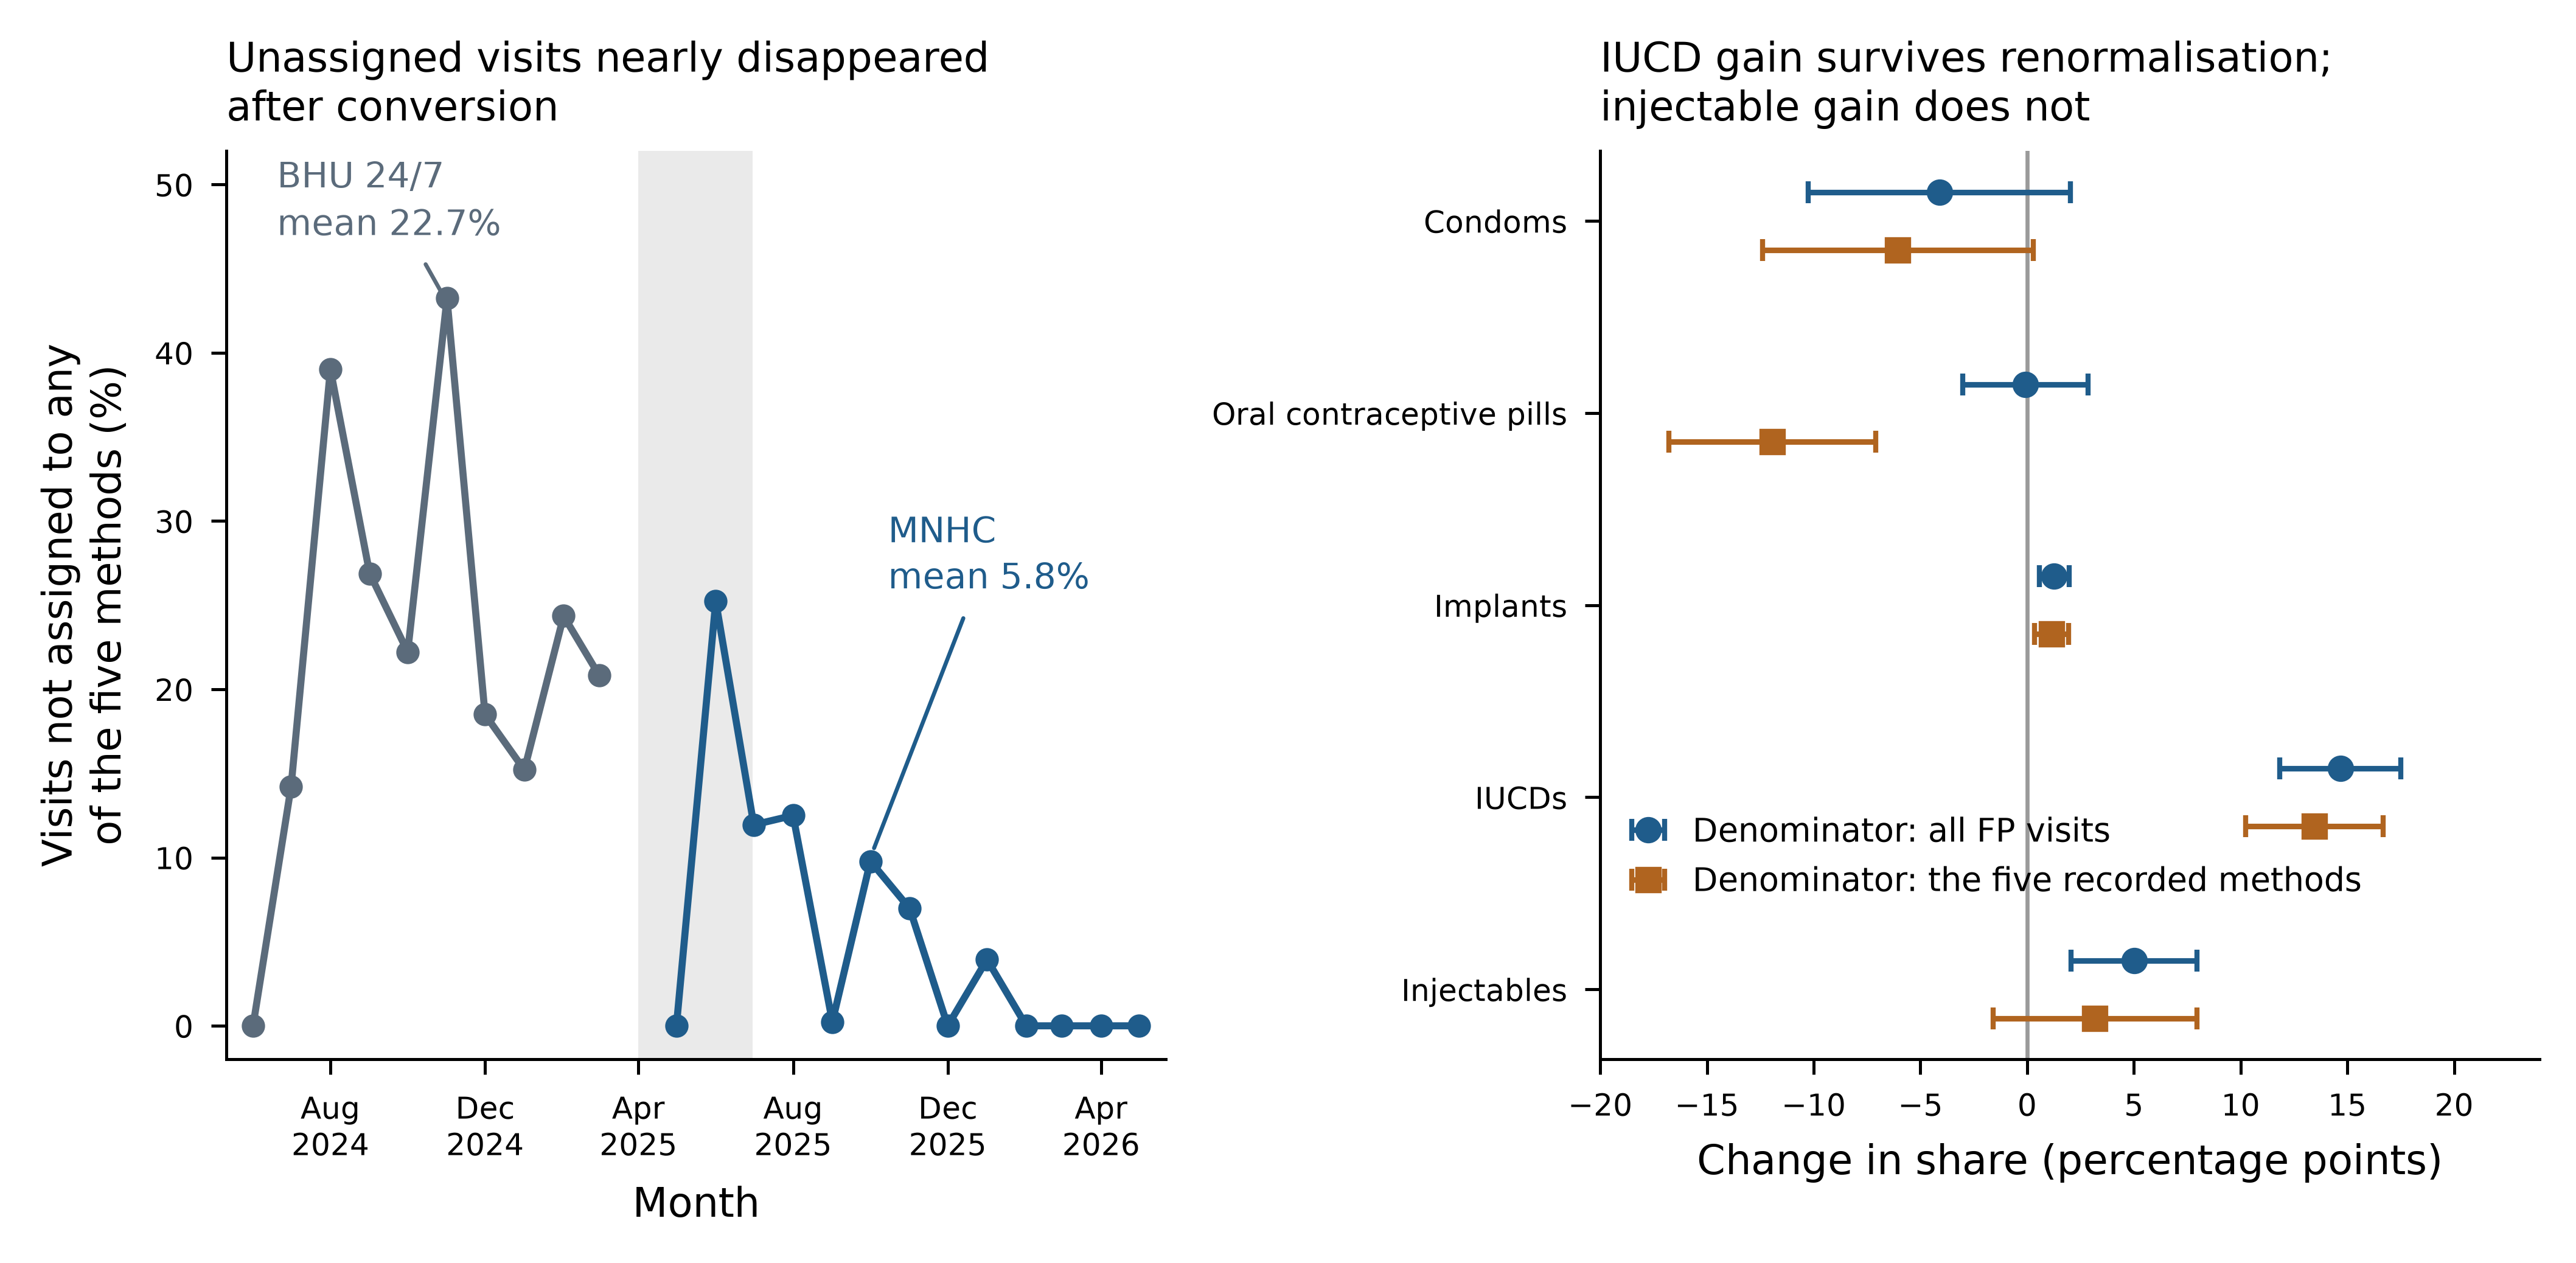
Figure 3. Reporting completeness and the method-mix sensitivity analysis. Left: monthly mean share of family planning visits not assigned to any of the five recorded methods, with the April–June 2025 handover window shaded. Right: change in each method’s share estimated with all family planning visits as the denominator and with the sum of the five recorded methods as the denominator; bars are 95% confidence intervals from the period-only mixed-effects model.
Two findings were robust to every prespecified analysis: the FP visit volume approximately doubled, and the IUCD visit share rose by approximately 15 percentage points. All other changes were either not significant or significant only under the analysis that treats facility months as independent (Figure 4). Supplementary Table S1, presented at the end of this article, reports both robust outcomes facility by facility, so their consistency across the nine sites can be inspected directly.
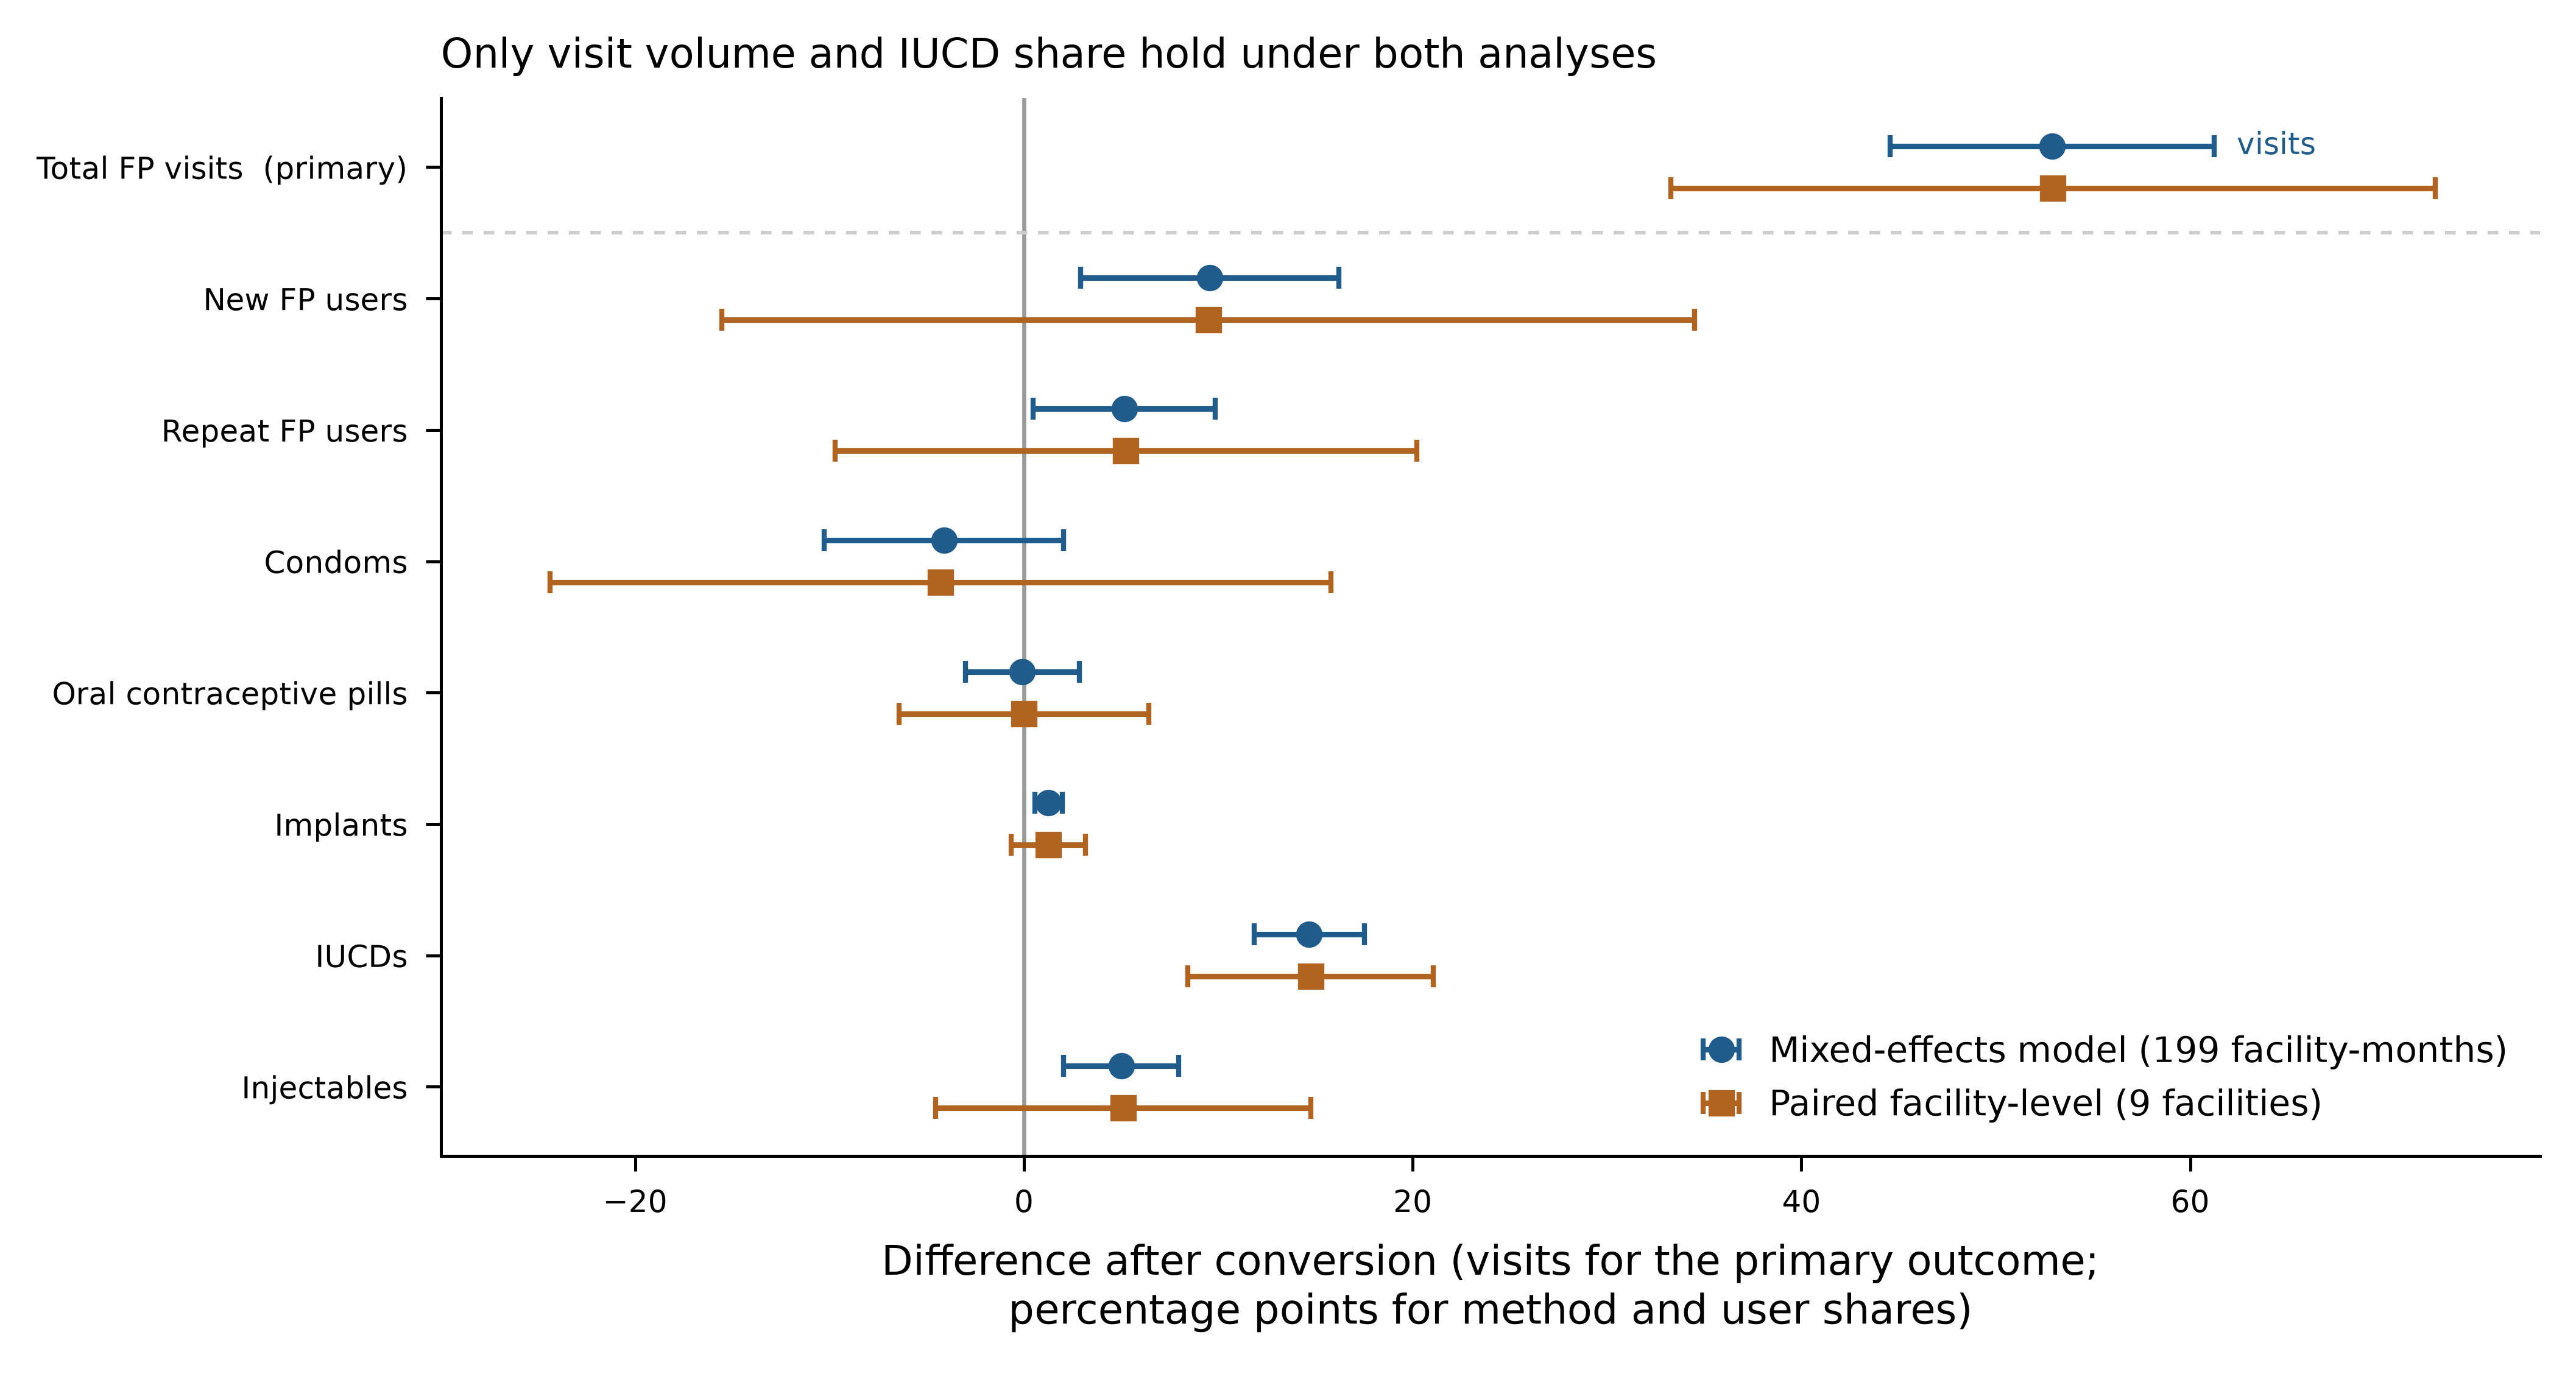
Figure 4. Adjusted differences after conversion for the primary outcome and the seven exploratory outcomes from the period-only mixed-effects model (199 facility-months) and from the paired facility-level fallback analysis (9 facilities). The bars are 95% confidence intervals. The primary outcome is in visits; all other outcomes are in percentage points of family planning visits. Only total visits and the intrauterine contraceptive device share exclude zero in both analyses.
4. Discussion
In this multidistrict facility-level study, the conversion of 24/7 BHUs to MNHCs in Punjab was followed by a near doubling of monthly FP visits and by a marked increase in the IUCD share of visits. Both findings held under a segmented mixed-effects analysis that accounted for within-facility correlation, under a paired analysis with only nine independent units, and in every one of the nine facilities. Changes in the new-user, injectable and implant shares were not robust to the choice of analysis and are reported as suggestive. Because the study had no comparison group, these findings describe what changed alongside the transition rather than what the transition caused.
The segmented analysis adds something that a simple pre-post comparison cannot. FP visits were not static before the handover: they were falling by approximately -2.57 per month, so the counterfactual against which the postconversion period should be judged was a declining one. The level shift at conversion (58.85 visits) and the reversal of the trend to +2.24 per month therefore argue against a simple continuation of a preexisting upward secular trend as the explanation. They do not exclude a coincident province-wide FP push, which only a control group of unconverted BHUs could address.
The increase in service volume fits the idea that the organization and availability of primary-care FP services influence uptake independently of individual demand [4,5,6,7], and it matches regional evidence that health-system-integrated interventions, not only demand generation, can increase modern contraceptive use [8]. Within Pakistan, government-partnered programs that strengthened facility readiness and outreach produced sustained increases in public-sector FP clients [17,18], and the wider literature on contracting out primary care points in the same direction, with a pooled 12% increase in FP service use [14]. A reorganized facility with a clear FP mandate, contracted management, and a digital patient pathway could plausibly attract more clients.
The IUCD result is more striking of the two robust findings, and it is notable in a setting where short-acting methods dominate; in Rawalpindi's public FP centers, IUCDs made up only approximately 2% of method use [16]. Evidence from other settings shows that structural changes can shift the method mix toward long-acting methods. In a cluster-randomized evaluation in the Democratic Republic of Congo, performance-based financing increased the availability of implants and injectables by 20 and 24 percentage points, respectively, and improved the quality of FP consultations [25]. In Canada, removing cost barriers produced an immediate and sustained rise in the use of long-acting reversible contraception [26]. Two features of our data support a service-side reading here. The IUCD share showed no pretransition trend and then increased steadily for a year after conversion rather than jumping once, which is the pattern expected from progressive provider training and commodity availability rather than from a one-off reclassification of records. In addition, the gain was greater, not smaller, when the first three MNHC months were dropped. It is nonetheless a gain that needs protection: Pakistani voucher programs have shown that IUCD use decreases sharply once support ends [20], and continuation depends on counseling quality and on how side effects and family pressure are handled [21]. Rising insertion figures do not by themselves show that women kept their devices.
Three changes that the original unadjusted analysis would have reported as significant do not survive a clustering-aware analysis, and it is worth being explicit about why. With nine facilities and an intraclass correlation of 0.177 for the primary outcome, 199 facility-months carry far less information than their number suggests; the new-user, injectable and implant shares all moved in the expected direction but varied so much between facilities that nine independent units cannot resolve them. The injectable finding is further weakened by the renormalization analysis, which removes it entirely, and the implant share remains low in absolute terms (1.36% of visits, approximately 1.47 clients per facility-month). These results are consistent with evidence on client preferences: in a discrete choice experiment conducted in 2022 across seven countries, including Pakistan, injectables were the most preferred format among Pakistani respondents, and intrauterine devices were less preferred in every country [27]. Community health volunteers also increased the provision of short- and long-acting methods in urban Sindh [18]. They are hypotheses for a controlled evaluation, not conclusions.
Reporting completeness changed at the same time as the model of care did, and this study quantifies that change rather than merely noting it. Visits not assigned to any of the five methods fell from 22.70% to 5.78%, and unassigned new/repeat visits fell from 16.10% to 1.18%. A review of FP registers in 18 low- and middle-income countries revealed wide variation in method detail and indicator definitions [22], and a change in reporting platform is exactly the circumstance in which such variation matters most. Two considerations limit how far this explanation can be taken. The residual category is too small to account for the IUCD gain on its own, and the gain survives when it is removed from the denominator. However, part of the increase in total recorded visits may still reflect more complete capture rather than more clients, and aggregate data cannot separate the two. A data-quality audit comparing register entries with electronic records at a sample of converted facilities would settle it.
Reporting absolute counts alongside shares also changes the reading of the method mix. In share terms, condom use appears to decrease and pill use stagnates; in volume terms, the number of condom clients increases 1.68-fold and that of pill clients increases 1.83-fold per facility month. No method lost volume. The method mix moved toward IUCDs because the IUCD provision grew faster than the other methods did, not because short-acting provisions fell. This distinction matters for commodity forecasting. Privacy and client experience, which strongly shape visit volume in private franchised clinics [19], are likely to matter for MNHCs as well.
These findings add facility-level, method-specific evidence to the literature dominated by household surveys, and they suggest where provincial monitoring should look next: whether IUCD users continue their methods, whether the increase in visits reflects new clients or improved reporting, and whether the gains persist once the program matures [22].
The study drew on repeated monthly observations from nine districts across northern, central and southern Punjab; excluded BHU reports from the handover months so that each period reflected a single model of care; analyzed the data with models that respect the clustered and serially correlated structure of facility-month reports; and prespecified a single primary outcome with familywise error control across the exploratory ones. Several limitations apply. First, there was no comparison group of facilities that remained 24/7 BHUs; a segmented design controls for a smooth preexisting trend but not for an event coinciding with the handover, so concurrent provincial FP activities cannot be separated from the effect of the transition. Second, only nine clusters were available. The mixed models borrow strength across facility-months, and their CIs should be read with the paired nine-facility results alongside them, as reported throughout and set out facility by facility in Supplementary Table S1. Third, the change in the reporting system at the transition may have altered how completely visits and methods were recorded; the residual-category analysis limits but does not eliminate this concern. Fourth, shares are unweighted means of monthly percentages, so months with few visits carry the same weight as busy months do; absolute counts are reported alongside them to make this visible. Fifth, eight facility-months recorded no method-specific users and were excluded from the renormalized analysis. Sixth, the aggregate data cannot reveal who the new users were, whether IUCD users continued their methods, or whether the quality of care improved. Finally, the nine facilities were one per district, and the basis on which each was selected from among the converted facilities in its district was not recorded; thus, they may not represent all the converted MNHCs.
5. Conclusions
In nine Punjab districts, the conversion of 24/7 BHUs into MNHCs was followed by two changes that were robust to every prespecified analysis: FP visits per facility-month roughly doubled, reversing a pretransition decline, and the IUCD share of visits rose by approximately 15 percentage points in every facility studied. The increases in new acceptors and in injectable and implant shares were significant only when facility-months were treated as independent and are reported as suggestive. Condom and pill shares were unchanged, although every method increased in absolute volume. Reporting completeness improved over the same period; thus, some of the volume increase may reflect better capture rather than more clients. Because the study was uncontrolled and based on aggregated routine data, these results are associations rather than effects. A controlled interrupted time series evaluation covering all converted facilities, with unconverted BHUs as comparators, follow-up of method continuation, and a data-quality audit, would show whether these gains are real, lasting and equitable.
6. Implications for policy and practice
For program managers, the results support keeping FP as a monitored core service in MNHCs and securing a steady supply of IUCDs together with training in insertion and removal, since IUCD provision is the component that demonstrably increased. Counseling that prepares women for side effects and scheduled follow-up are needed if higher uptake is to become sustained use. Routine reports would be more useful if they separated new acceptors, method switchers and continuing users, if the residual “other” category was itemized so that reporting completeness could be audited directly, and if the same indicators were reported by facilities that have not yet been converted so that future evaluations can include a comparison group.
Abbreviations
BHU: Basic Health Unit
CI: Confidence interval
FP: Family planning
GEE: Generalized estimating equation
IUCD: Intrauterine contraceptive device
MNHC: Maryam Nawaz Health Clinic
OR: Odds ratio
Supplementary materials
The following supporting information can be accessed through the embedded links: Supplementary File S1. RECORD statement checklist; and Supplementary Table S1. Primary outcome and intrauterine contraceptive device use by facility before and after conversion.
Author contributions
Conceptualization, UAK, SA, FA, TB, NM, & MT; methodology, UAK, TB, NM, and MT; software, TB, and NM; validation, UAK, SA, and FA; formal analysis, UAK, TB, and MT; investigation, UAK, SA, and FA; resources, UAK, and MT; data curation, TB, and NM; writing—original draft preparation, SA, FA, TB, and NM; writing—review and editing, UAK, and MT; visualization, TB, and MT; supervision, MT; project administration, UAK. All authors have read and agreed to the published version of the manuscript.
Publication history
| Received | Revised | Accepted | Published |
| 03 August 2026 | 14 September 2026 | 17 September 2026 | 20 September 2026 |
Use of generative AI and AI-assisted technologies
The authors declare that no generative AI or AI-assisted technologies were used in the preparation of this work.
Funding
This research received no specific grant from the public, commercial, or not-for-profit funding agencies.
Trial registration
Not applicable.
Ethics statement and consent to participate
Ethical approval was granted by the DSI Research Ethics Committee (reference no. DSI-REC/26/00001), and permission to use the data were obtained from the Project Management Unit of the Punjab Family Planning Program, Health and Population Department, Government of Punjab. The study analyzed aggregated facility-level reports that contained no individual client identifiers, and no individual client records were accessed; therefore, the ethics committee waived the requirement for individual informed consent.
Consent to publication
Data availability
The data supporting this study's findings are available from the corresponding author, Muhammad Tariq, upon reasonable request.
Acknowledgements
None.
Conflicts of interest
The authors declare no conflicts of interest.